Overview
For visualizing TEI/XML files, I created a repository that publishes visualization examples and source code.
https://github.com/nakamura196/tei_visualize_demo
You can see the visualization examples on the following page.
https://nakamura196.github.io/tei_visualize_demo/
This time, I added an example of marker display using MarkerCluster, which I’ll introduce here.
Prerequisites
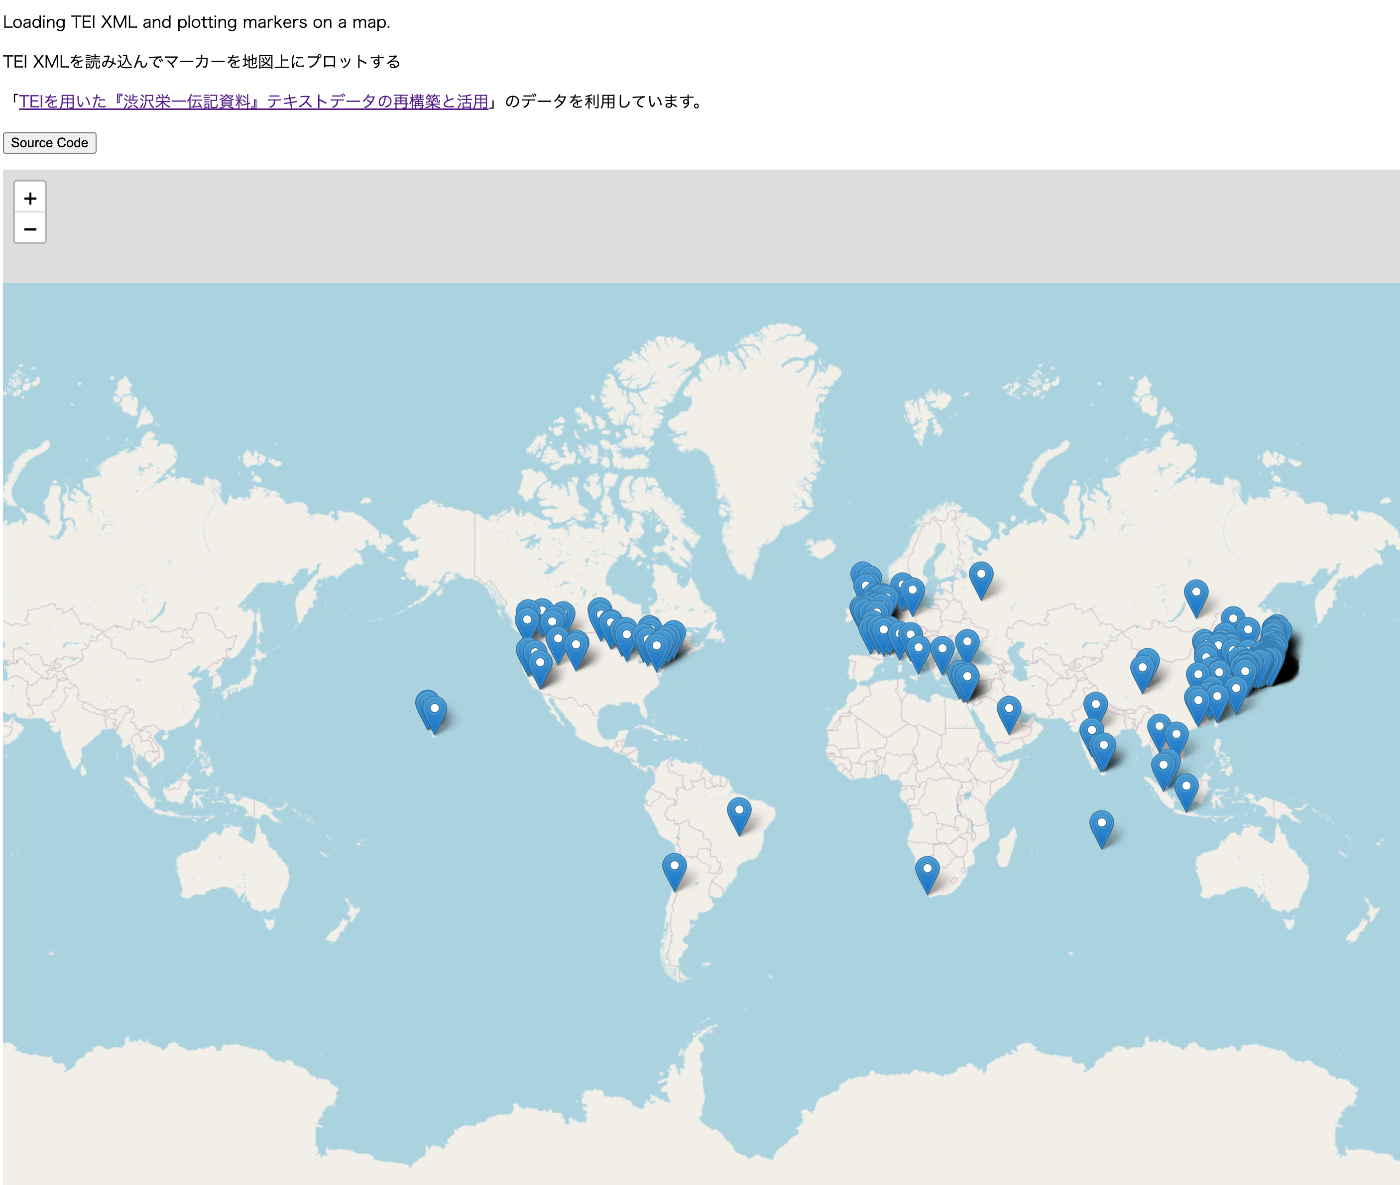
This assumes that you can already display markers using Leaflet (without using MarkerCluster). If you haven’t done so yet, please refer to the following visualization example and source code.
Visualization example
https://nakamura196.github.io/tei_visualize_demo/01/
Source code
https://github.com/nakamura196/tei_visualize_demo/blob/main/docs/01/index.html
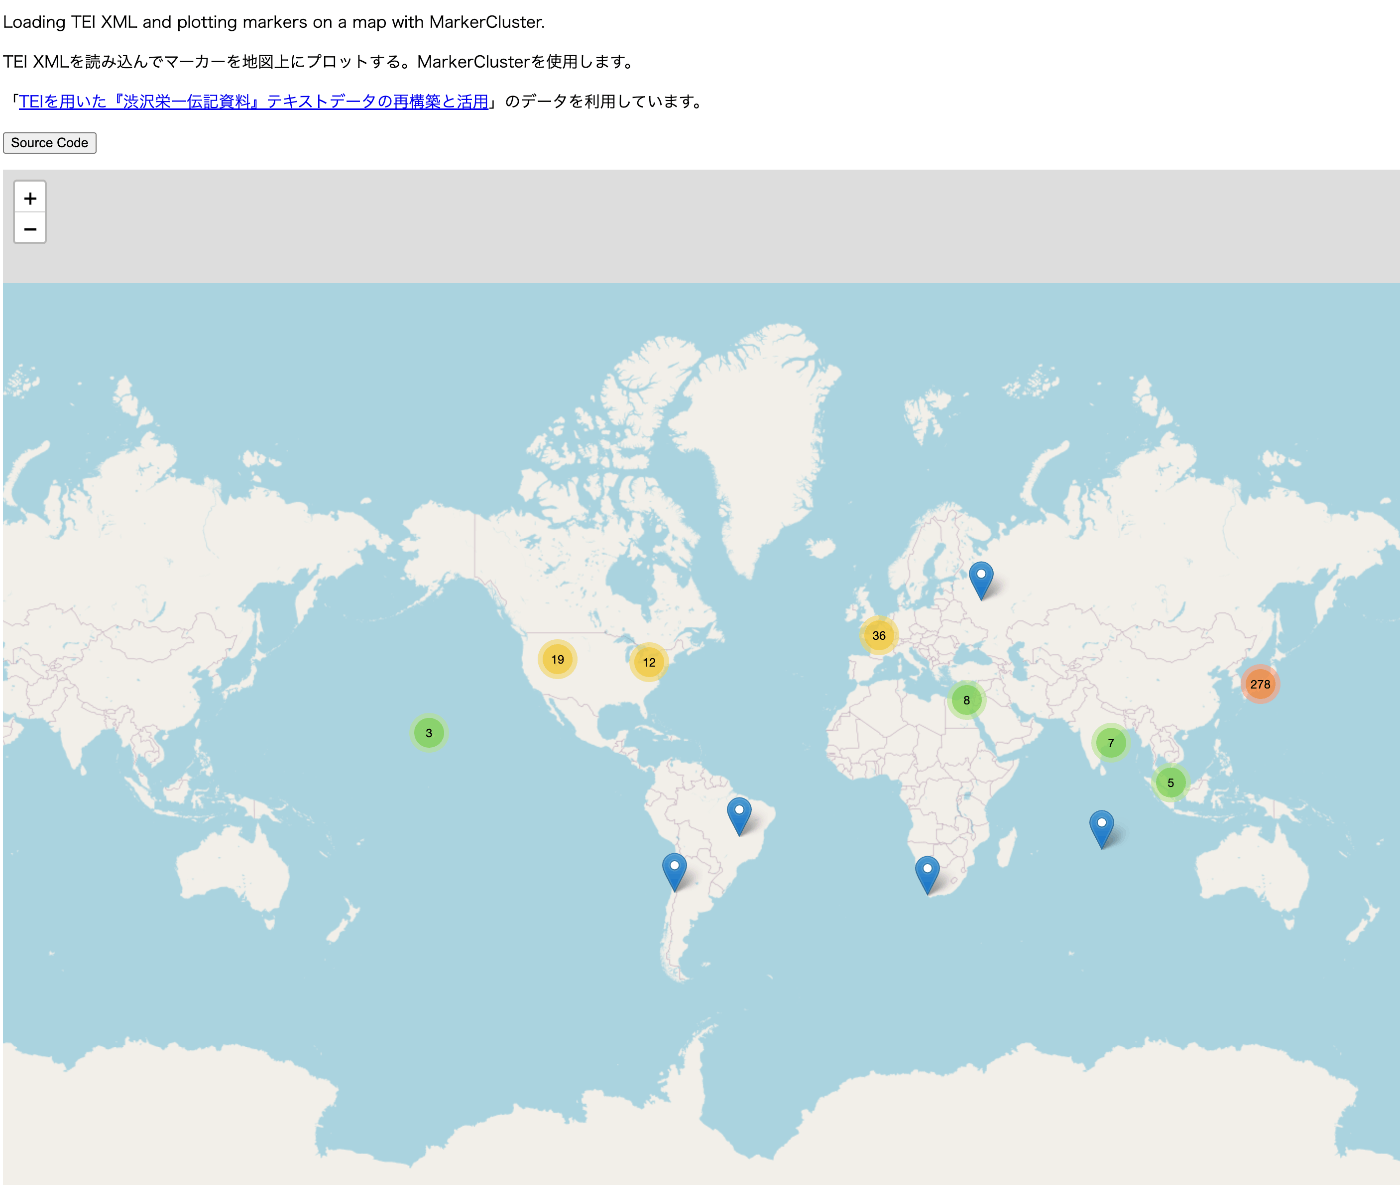
Implementation Example Using MarkerCluster
The visualization example is as follows.
https://nakamura196.github.io/tei_visualize_demo/02/
The source code is as follows.
https://github.com/nakamura196/tei_visualize_demo/blob/main/docs/02/index.html
This uses data from “Reconstruction and Utilization of Text Data from ‘Shibusawa Eiichi Biographical Materials’ Using TEI”.
Adding the Library
Add the following.
Using L.markerClusterGroup
Create markers and add individual marker objects using the addLayer method. Finally, add markers to the map using the addLayer method.
Summary
I hope this serves as a helpful reference for visualizing TEI/XML.